State Freight: Vermont
State: Vermont
Nickname: The Green Mountain State
Population: 626,299 (2018)
Capital: Montpelier
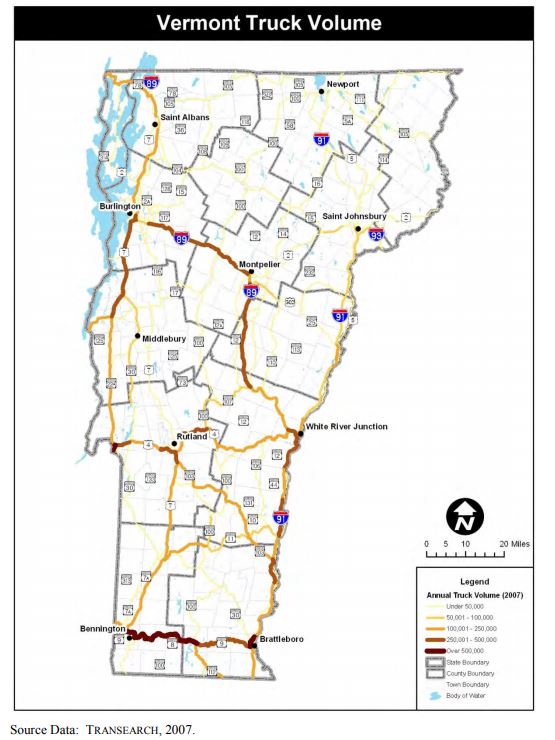
Large Freight Volume Cities: Burlington, South Burlington, Rutland, Essex, Colchester, Bennington, Brattleboro, Milton, Barre, Montpelier.
The following information is based on the Vermont Freight Plan that was prepared by Cambridge Systematics for the Vermont Agency of Transportation.
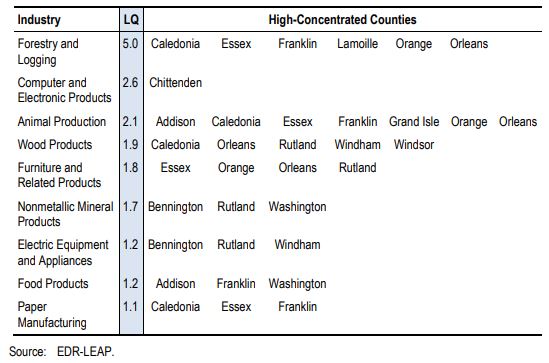
According to the Vermont Agency of Transportation, the highest-volume commodity of outbound freight for Vermont are forestry and logging, followed by computer and electronic products.
Many of the industry clusters concentrated in Vermont that depend on natural resources (e.g., forestry and logging) are highly interconnected and rely heavily on freight transportation. For example, the output from forestry and logging production is used for the manufacture of wood products (e.g., lumber), which are then used to make furniture, paper, and paper products. The animal production and food production sectors are also closely connected; for example, farming and dairy products to cheddar cheese and ice cream production. The computer and electronics products sector, represented primarily by the IBM plant in Essex Junction, has a high LQ and is also the largest employer in the state. It is particularly reliant on truck and air freight transportation to supply both inputs to the manufacturing processes (primarily by truck) and a means of delivering outputs to subsequent steps in the manufacturing process (trucking in North America according to a report prepared by Cambridge Systematics, Inc.
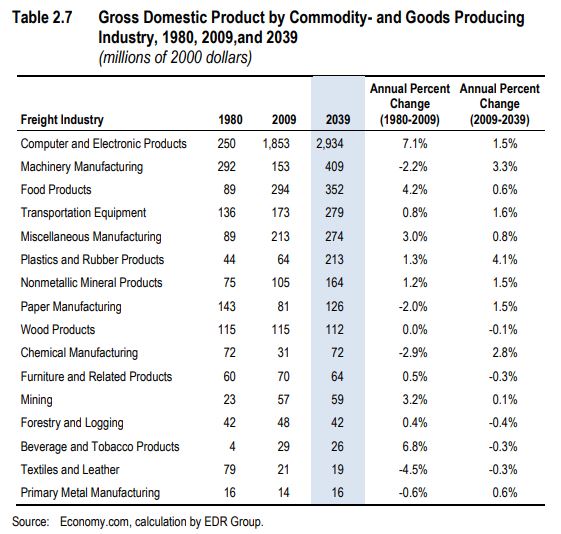
Comparing the annual historical and future growth rates show dramatic shifts in projected growth and production rates. For example, the output of the paper and chemical manufacturing industries fell between 1980 and 2009, yet both industries are projected to grow in the future—by 1.5 percent and 2.8 percent annually, respectively. The largest manufacturing sector, computers, and electronics are projected to grow, but at a much slower rate than in the past—1.5 percent compared to 7.1 percent historically. These shifts have important implications for freight planning, in that changes in production volumes of bulk manufacturing industries influence the need for both truck and rail system capacity, but the computer and electronics production is almost entirely dependent on truck transportation.
Vermont’s primary trading partners are in the Northeast. New York is Vermont’s top trading partner among the Northeast states, accounting for almost half of all freight flows. At 10 percent of all freight activity by value, Canada is an important trading partner and, if ranked among the U.S. states, would come in second after New York.
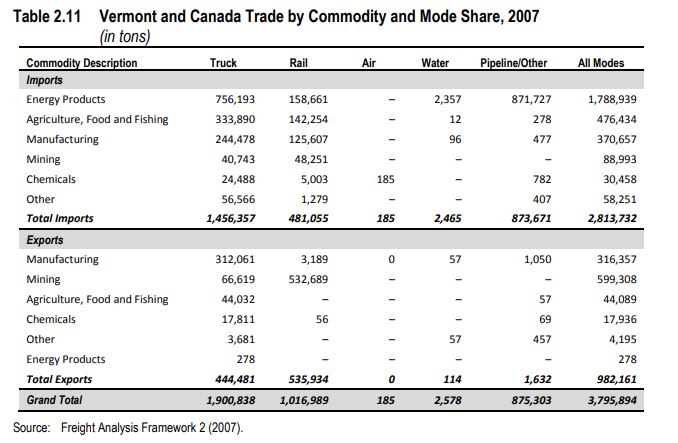
The relatively robust growth of the Canadian agriculture, forestry, wood products, and manufacturing industries—compared to their counterparts in Vermont—implies that Vermont industries will continue to import Canadian commodities and products for both consumptions by Vermont residents and use in production by Vermont industries. Examples include forestry products used for pulp, paper and wood product manufacturing and chemicals that are used in electronics manufacturing in Vermont. Rail is used to export non-metallic minerals (primarily building stone) and import coal and petroleum products, animal feed and products, wood products; cereal grains (including seed) and some non-metallic minerals. While rail is cost-effective for shipping such heavy and bulky products, the shipping distances are relatively short, so rail has captured only a modest share of the trade between Vermont and Eastern Canada.
Vermont’s major trading partner is New York State. Canada and the rest of the United States. Freight inbound from New York dominates the trade pattern. Much of this trade is accounted for by relatively high-value food, clothing, equipment, and consumer merchandise moving by truck, rail, and ship to major distribution centers in New York (primarily in the Albany area), and then reloaded and delivered by truck to stores and businesses in Vermont. Outbound freight value is about one-quarter of the value of inbound freight, again with New York State the largest trading partner. The industries are shown in descending order of growth rate for the overall Northeast and MidAtlantic region. The GDP projections show relatively robust rates of growth across several manufacturing industries, many of which are linked to suppliers and manufacturers in Vermont. Because the travel distances are relatively short, the key to realizing growth in these industries will be fast and reliable truck service between Vermont and its neighboring states.
A potential growth market for Vermont may be in food products. Vermont has traditionally been focused on providing a range of agricultural products for New England and Mid-Atlantic markets. Vermont has also been diligent about developing several private and non-profit agricultural programs in Vermont. Agricultural initiatives in the state are focused on categories such as artisanal cheeses, specialty, and organic food production and linking local food production to local and regional markets. While many of the early initiatives in these areas, especially “farmers markets,” focused on gaining access to county and state farm products, new initiatives throughout New England and the Mid-Atlantic states are focusing on gaining access to farm products from across the Northeast and the Mid-Atlantic.
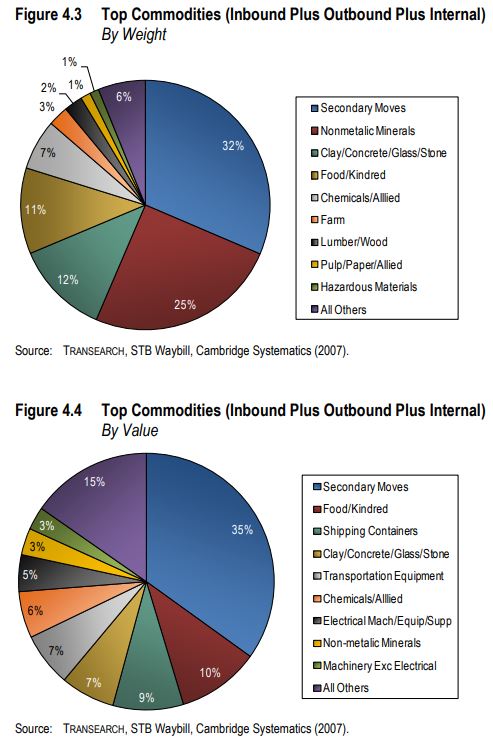
Overall Commodity Movements Over 52 million tons of freight, worth approximately $58 billion, were transported into, out of, within and through Vermont via highway, railroad, and air. Inbound movements accounted for 18.5 million tons with a value of $24.4 billion; Outbound movements accounted for 8.1 million tons with a value of $6.2 billion; Intrastate movements (entirely within Vermont) accounted for 5.3 million tons with a value of $3.4 billion.
Outbound shipments account for 16 percent of total shipments by weight and 12 percent by value. Over 70 percent of these shipments are destined for New York, Massachusetts, and New Hampshire. The primary export is nonmetallic minerals, followed by clay/concrete/glass/stone and food. Intrastate shipments are comprised almost entirely of nonmetallic minerals, clay/concrete/glass/stone, secondary moves, and food. These make up 10 percent of all shipments by weight and six percent by value. Chittenden County is the largest recipient of inbound flows (5.2 million tons annually), reflecting the goods needed to serve its population base. These shipments are made up of secondary moves, chemicals, food, and nonmetallic minerals. Bennington is the second-largest importer of goods in Vermont with 2.4 million tons imported, while five other counties each import over one million tons annually. Rutland County represents the largest source of outbound flows by weight (4.3 million tons annually); these shipments are composed primarily of nonmetallic minerals (3.2 million tons) and clay/concrete/glass/stones (2.7 million tons). Chittenden County also plays a key role in outbound shipments, with over 1.2 million tons of food, nonmetallic minerals, and secondary moves.
In conclusion, Vermont may have the second smallest population in the United States, but there is plenty of freight opportunities, especially by truck. Forestry, logging, computer and electronic equipment manufacturing as well as a growing food manufacturing industry are in need of transportation partners. Vermont’s largest trading partner is the state of New York, followed by Canada.
The report used facts, numbers, records and charts found in the Vermont Freight Plan prepared by the Cambridge Systematics.